
AFM+
The afm+® from Anasys is a full featured Atomic Force Microscope (AFM) with powerful analytical capabilities that make it much more than just an imaging tool. The afm+ is easy to set up and operate, there is decades of AFM expertise distilled into instrument design which means faster time to results, even for novice users. Reveal what you have been missing with the afm+

The Anasys afm+ offers a full featured AFM with powerful analytical capabilities that make it much much more than just an imaging tool. Some of the key aspects are:
Full featured AFM
- All common imaging modes
- High resolution closed loop imaging with excellent noise performance
Easy to setup and operation
- The afm+ is built for maximum ease of use; premounted cantilevers allow fast and easy alignment
- Motorized sample stage and high quality optics allow rapid location of the analysis area
- Decades of AFM expertise distilled into instrument design means faster time to results, even for novice users
Powerful localized nanoscale analytical techniques pioneered by Anasys world leading scientific team
- Thermal: nanoscale thermal analysis with our patented ThermaLever probes
- Mechanical: wideband nanomechanical analysis with our Lorentz Contact Resonance mode
- Chemistry: upgradeable to add nanoscale IR Spectroscopy for localized chemical composition
Nanoscale Thermal Analysis (nano-TA)
Based on our proprietary thermal probe technology, the afm+ allows you to obtain transition temperatures on any local feature of your sample or to obtain a transition temperature map.
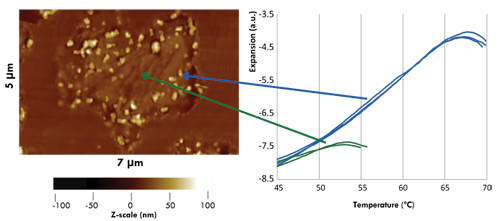
An AFM image with nano-TA data of a toner particle. The particle was embedded in epoxy and microtomed. The topography of the sample shows variations in structure, which can then be analyzed using nano-TA. Toner particles include a number of components (wax, resin, dye, etc.) that exhibit different transition temperatures.
Scanning Thermal Microscopy (SThM)
This mode of the afm+ allows you to map relative thermal conductivity and relative temperature differences across your sample.
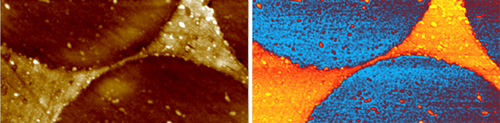
The 4µm x 8µm image shown here utilizes the scanning thermal microscopy (SThM) functionality of the afm+ system on a carbon fiber – epoxy composite sample. The sample was cut and polished to form a smooth surface. The height image (left) shows a number of carbon fibers, while the SThM image (right) shows the change in probe temperature on the two materials due to their differences in thermal conductivity. This sample demonstrates the high lateral-resolution capability of the SThM technique.
Transition Temperature Microscopy
Transition temperature microscopy (TTM) is a fully automated mode in which an array of nano-TA measurements are rapidly performed and each temperature ramp is automatically analyzed to determine the transition temperature.
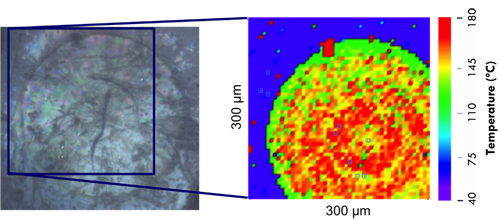
An optical image and a TTM map of a banded spherulite composed of poly (L-lactic acid) (PLLA). This TTM map was created by using the motorized XY stage. The blue areas in the TTM map are amorphous PLLA; the red and yellow areas are crystalline areas. The “onion-like” structure in the spherulite was created by stepping the temperature back and forth during the crystallization process to create regions with a higher or lower degree of crystallinity. Sample courtesy of J. Morikawa, Tokyo Institute of Technology.
Upgradeable Analytical Capabilities
• Point-and-click nanoscale IR spectroscopy
• IR spectra that correlate to FTIR libraries
• Chemical imaging
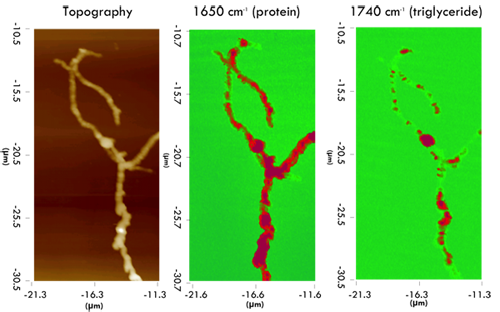
Topography and IR images collected at 1650 cm-1 and 1740 cm-1 of Streptomyces bacteria. These bacteria form lipid-filled vesicles in later stages of growth. The location of these vesicles can be determined by imaging at 1740 cm-1, an absorption band specific to the lipid. The vesicles can be resolved to sub-100nm resolution using the nanoIR.
Mechanical properties of your sample can be collected using a contact resonance method to map stiffness variations simultaneously with the topography.
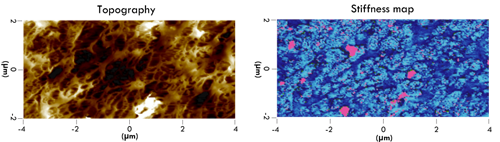
A 4µm x 8µm topography image and stiffness map of a three-component polymer blend. The stiffness map, which measures the variation in modulus by analyzing the contact resonance of the cantilever, clearly resolves the three materials.
Multifunctional Nanoscale Measurement Suite
The new afm+ is fully upgradeable to our nanoIR system, a probe-based measurement tool that utilizes infrared spectroscopy to reveal chemical composition at the nanoscale. The nanoIR also provides high-resolution characterization of local topographic, mechanical, and thermal properties. Potential application areas span the realms of polymer science, materials science, and life science, including detailed studies of structure-property correlations.
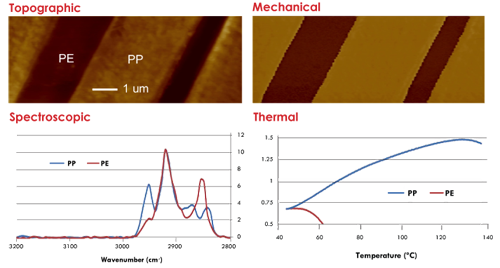
An example of the multi-property measurement capability of the nanoIR system. The sample is a multilayer film composed of polyethylene and polypropylene. The two materials can be clearly identified by their unique absorption bands. In addition, the difference in stiffness and transition temperature of the two materials can be measured.

